Introduction
A pathway analysis is an important step in the final biological interpretation of experimental results in most omics studies. For non-model species however this often becomes a difficult endeavor due to the lack of functional information. The Combined Pathway Analysis tool allows to identify pathways from multiple pathway databases for any set of sequences. In combination with differential expression data the tool allows to calculate pathway enrichment. A result table allows filtering for enriched pathways with linked, differentially expressed, genes.
The Combined Pathway Analysis is available as part of the Functional Analysis Module since OmicsBox 2.0.
How to find enriched pathways for my expression data.
The tools allows to identify enriched pathways for any set of sequencing data.
The input sequences are getting linked to KEGG and Reactome databases in 2 different ways: Sequence-Based and Annotation-Based.
- For Reactome pathways sequences are blasted against a database of all UniProt protein sequences in Reactome or, if available, GO IDs Biological Process terms are directly linked to Reactome Pathways in combination with Molecular Function Terms.
- For KEGG, sequences are annotated with KEGG Orthologs or, if available, Enzyme codes are directly mapped to the corresponding KEGG Reference Pathways.
NOTE: The sequence-based linking methods do not depend on the species. This allows to run the pathway analysis on any set of sequences which makes it very useful for non-model species.
Enrichment Analysis
Once pathways and sequences are linked, differential expression data is used to perform enrichment analysis. Differential expression data has to be provided as OmicsBox project which can be generated from scratch based on a count table.
NOTE: If a raw count table is available it is recommended to perform the differential expression analysis within OmicsBox to avoid data compatibility issues. This often takes only a few minutes and pair-wise as well as time-course differential expression analysis options are available.
NOTE: Do not worry if the final differential expression data analysis is not yet available at the time of running the analysis. The data can be added or replaced at a later moment in the analysis.
The enrichment analysis can be performed with two alternative methods: Gene Set Enrichment Analysis (GSEA) or a Fisher’s Exact Test. The GSEA calculates enrichment based on the annotation of a ranked list. This ranking is based on a combination of the log fold change and the p-value. The Fisher Exact Test calculates enrichment based on a comparison of two sets in a contingency table. The two sets are typically differentially expressed genes versus non-differentially expressed genes.
This final result is a table of all identified pathways which can be sorted by the number of linked sequences, differentially expressed sequences or whether a pathway is enriched, i.e. more frequently associated, among a group of differentially expressed sequences.
Result in Interpretation and Visualisation
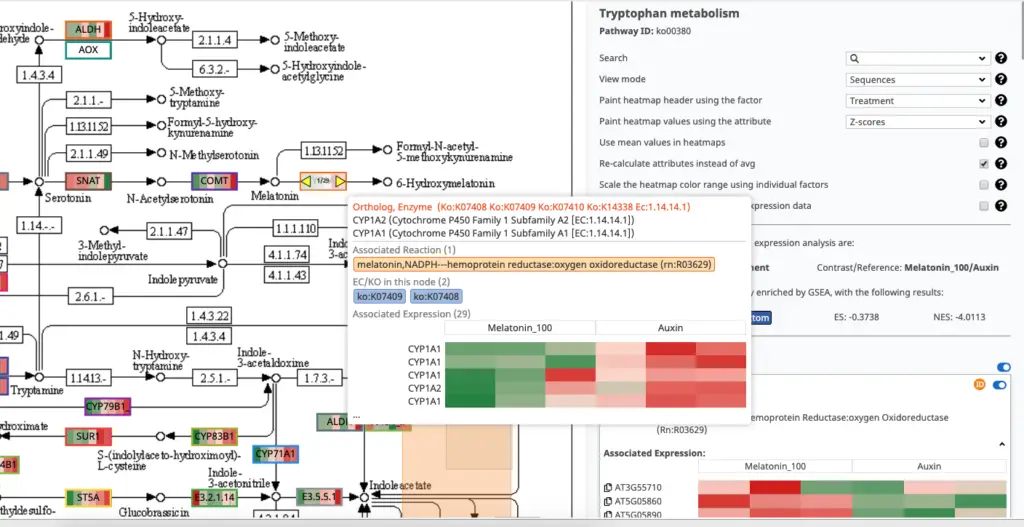
Finally, the Pathway Visualization tool helps to review the pathways and to find altered regions. Enzymes or Entities are highlighted together with its expression profiles.
NOTE: A good way to find significant results is to use a combination of filtering and sorting of the result table. Sort for pathways with the most differentially expressed sequences (or the most linked sequences) and filter for only enriched pathways (Tag TOP or BOTTOM). This allows you to find statistically enriched pathways with many differentially expressed genes. Now use the “View Pathway” option from the context many to review the details of the “top” pathways.
Once the most relevant pathways have been identified, the visualization tool helps review its details. The side panel allows you to configure and search of the pathway details. Each element has a tooltip that provides additional information.
NOTE: Use the “Paint expression data in the map” combined with the “Show only results with differential expression data” to quickly identify altered entities (enzymes/proteins) and use the context menu to read the corresponding sequence description lines.
References
- OmicsBox – Bioinformatics made easy (Version 2.0.10). BioBam Bioinformatics. March 3, 2019. OmicsBox | BioBam | Bioinformatics Made Easy
- Kanehisa M. and Goto S. (2000). KEGG: kyoto encyclopedia of genes and genomes. Nucleic acids research, 28(1), 27-30.
- Fabregat A et al. (2018). The Reactome Pathway Knowledgebase. Nucleic acids research, 46(D1), D649-D655.


